Case Study: Online Feedback Reporting in a New York Hospital
To better understand the value and impact of enhanced methods for reporting patient feedback, an AHRQ-funded research team collaborated on a study with New York-Presbyterian Hospital (NYP). The goal of this study was to assess whether and how an online interactive report designed to facilitate interpretation of patient narratives affected ambulatory staff learning, behavior at the individual staff and practice level, and patient experience survey scores.
The report included these key features:
- A “dashboard” page that provided an overview of narrative valence over time for a clinical practice and a visual link between the valence of narrative content for particular domains of experience and the practice’s scores on the survey measures in each domain (Figure 1).
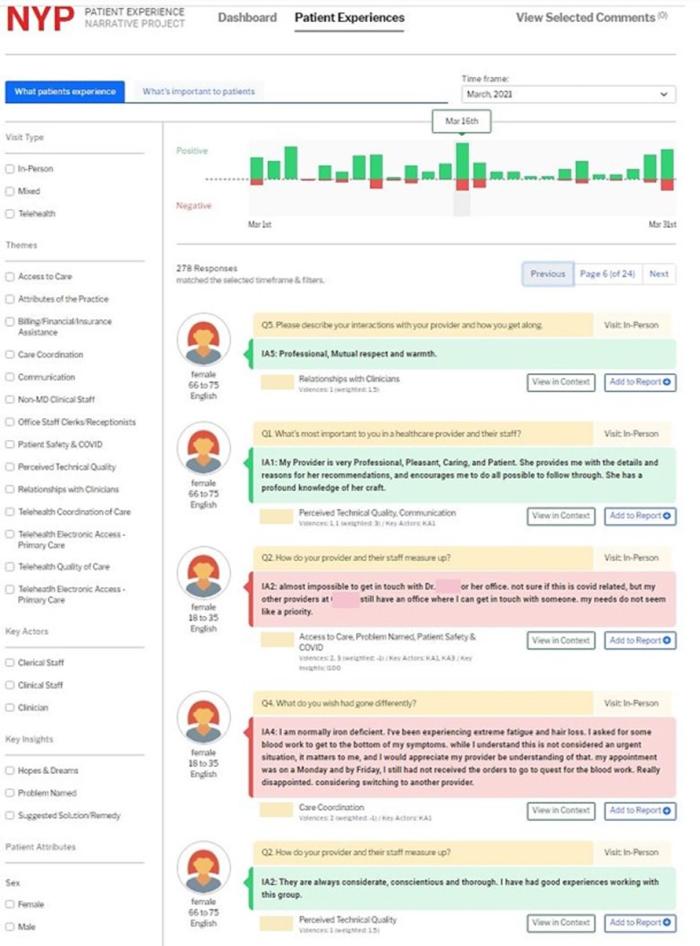
- A page that allowed the user to filter narratives based on time frame, experiential themes, and patient attributes, along with the capacity to place those thematic assessments in the context of the complete narrative response (Figure 2).
- A page that allowed the user to generate downloadable action reports to share a subset of narratives more broadly within the practice.
Evaluation of the feedback reporting tool’s impact showed significant positive effects on staff learning, as well as behavior changes for both individual staff and the practice as a whole. Users of the report noted that the online tool simplified the complex task of accessing and interpreting patient narratives, allowing them to assess performance over time, understand what was and was not working well, and extract helpful examples of improvement opportunities. Practice sites with access to the report also experienced improvements in survey scores in areas targeted for improvement.
 Learn more about this study:
- Learning From Patient Narratives Through Innovative Feedback Reporting Methods (webcast recording, May 2023).
- Shaller D, Nembhard I, Matta S, et al. Assessing an innovative method to promote learning from patient narratives: Findings from a field experiment in ambulatory care. Health Serv Res. Apr 2024, 59(2): 14245.
Figure 1. NYP Patient Narrative Report Dashboard Page
The Dashboard Page presents summary information on the comments received and coded for the selected practice. It allows users to select a specific month. For the selected month, the dashboard shows the number of comments by valence, selected themes, and by specific dates of the month selected. The distribution of positive and negative comments is also shown by CG-CAHPS composite measure, with a comparison to the CG-CAHPS scores for in-person visits as well as key indicator scores for both in-person and telehealth visits.
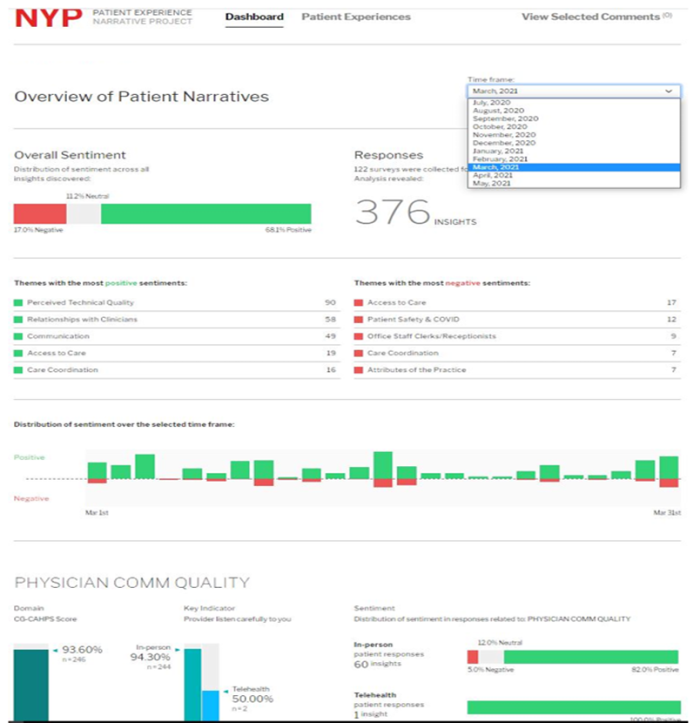
Figure 2. NYP Patient Narrative Report Detail Page
The Patient Experiences detail page allows the user to view all patient comments for the selected month with the ability to sort them by key themes, key insights, key actors, patient attributes, and date of visit.